video, tutorial, visualization, saving
Orange Essentials: Saving Graphs
Ajda Pretnar Žagar
Dec 10, 2025
We've launched a new video series on YouTube! It is called Orange Essentials, and it covers the technical basics of working with Orange, from installation and setting up a workflow to sharing the results and interactive data exploration. It features seven short videos, which are launched weekly.
The fourth video shows how to save visualizations created in Orange. Let us see Scatter Plot for example. In the bottom left corner, there is a save icon. When clicking it, a saving dialogue will open. You can save the graph in several formats, including matplotlib code. You can also use the copy-paste shortcut to quickly place graphs into presentations or documents.
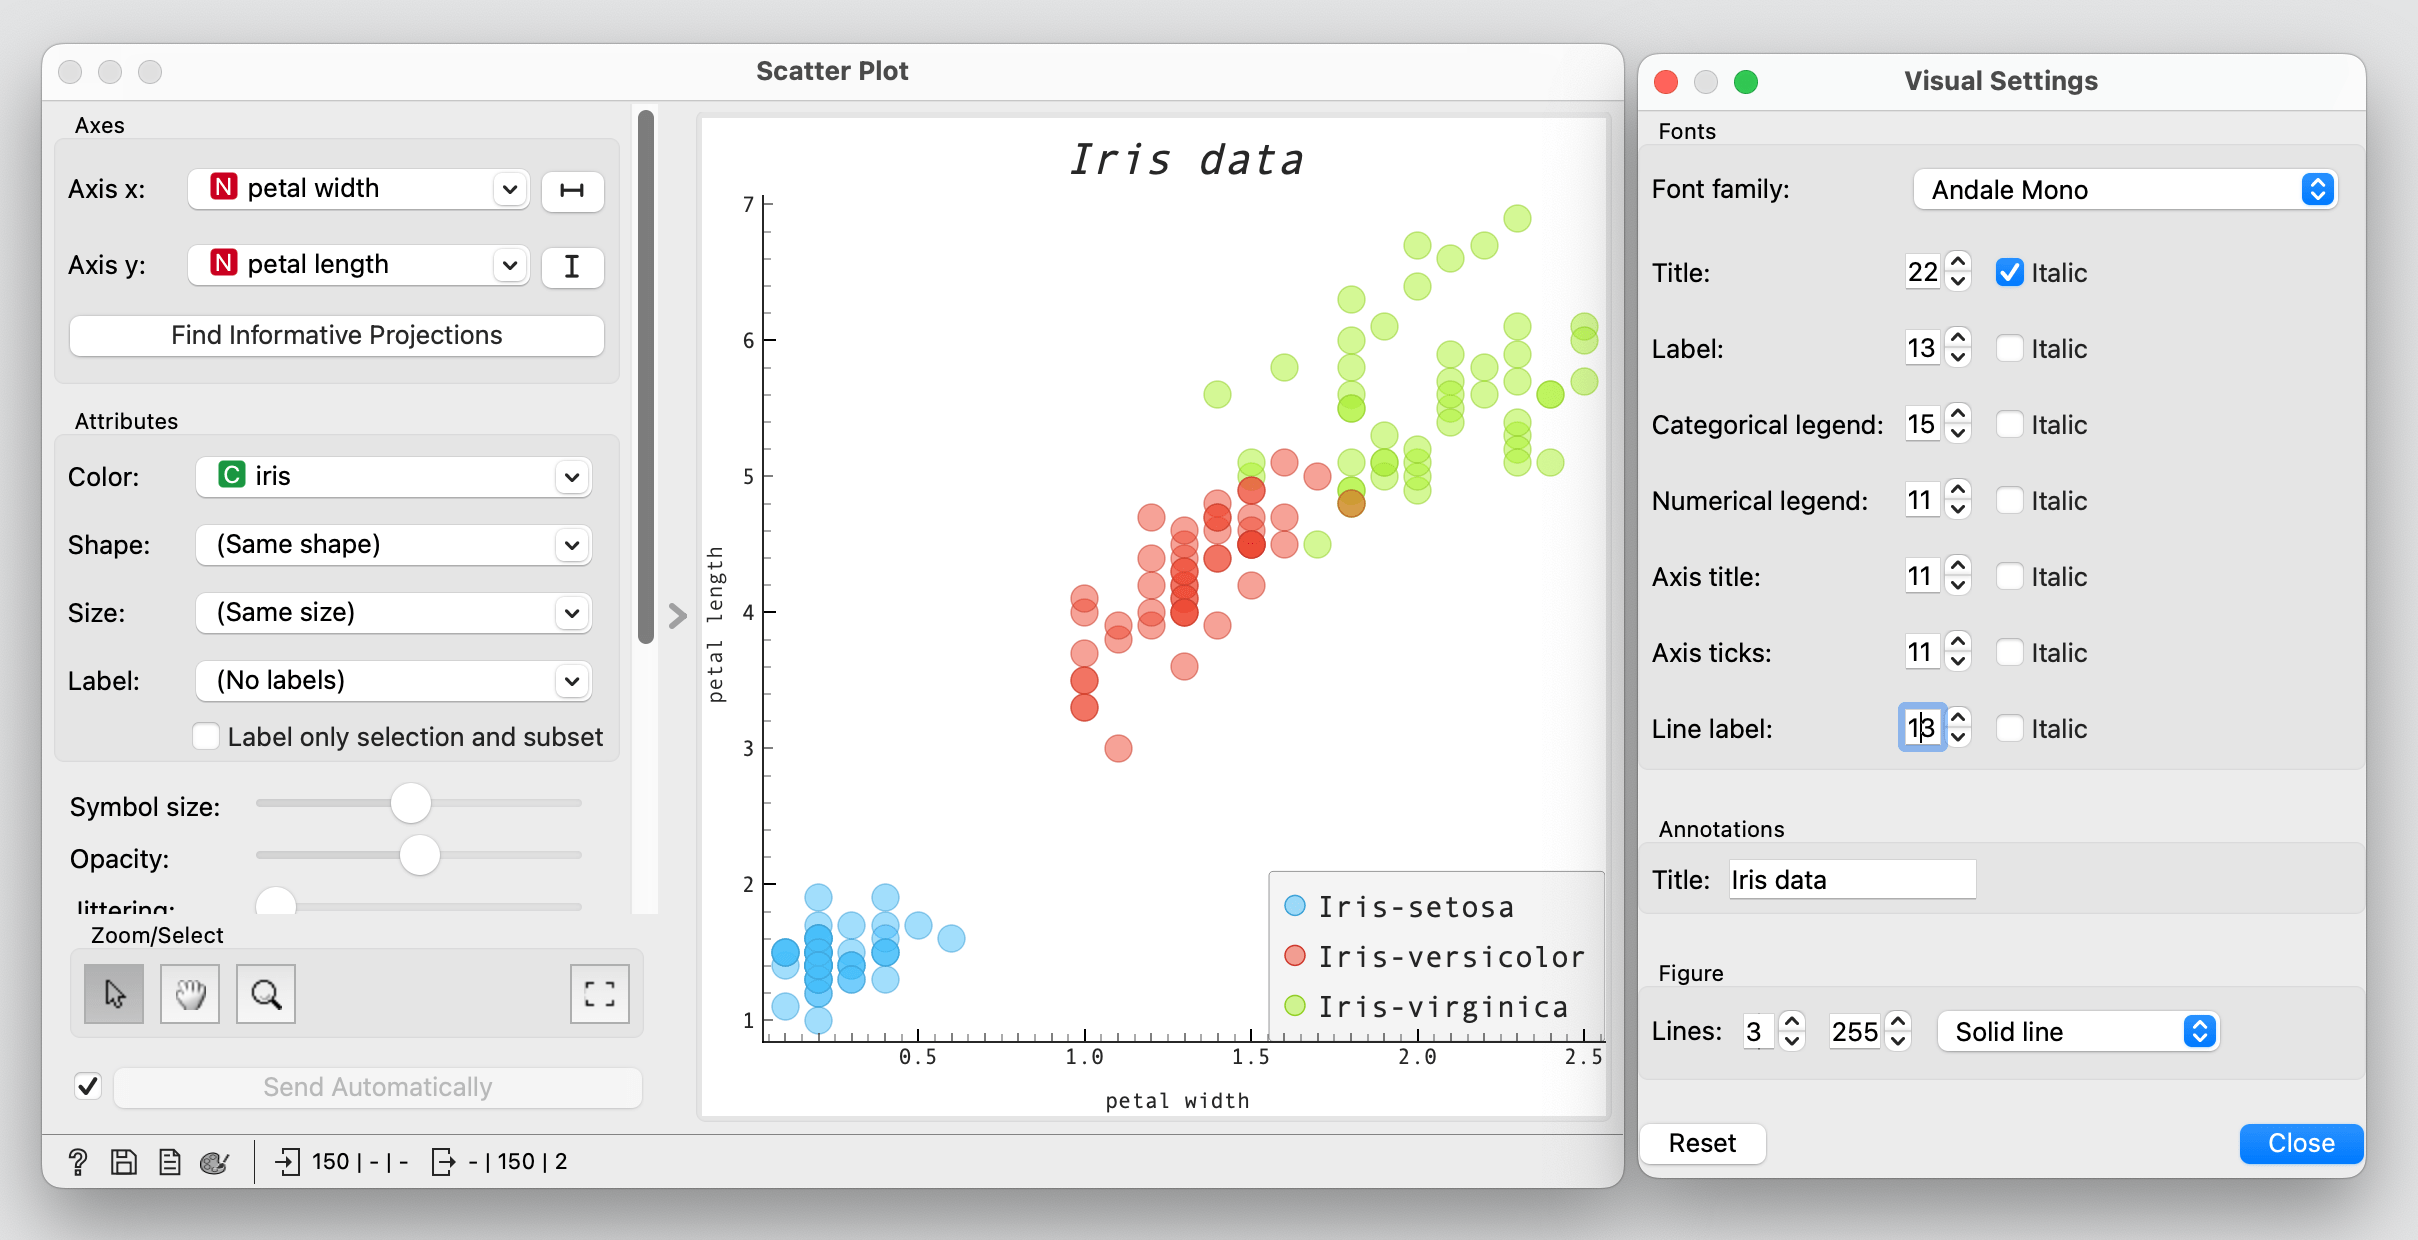
Another exciting option is available under the Show View Options (palette icon). Show View Options opens a dialogue for setting visual properties of the graph, such as line thickness, title, font, and so on.
The development of the Orange Essentials video series was possible thanks to the NumFocus Small Development Grant.